Task Dashboard - Task Management Solution
CentriQS dashboard reporting software offers interactive dashboard view for task and project management. Task and project management dashboard updates automatically to provide users with required information for better decision making and problem resolving. Users can create multiple task dashboards and customize dashboard reports as they wish to show the appropriate data in each chart, pivot grid or any other view.
What is Dashboard for Task and Project Management?
Task dashboard is a single view that includes multiple task-related views to let users see “the big picture” of the work they do. Managers and team leaders can use task dashboard to measure their team performance, get a graphical view of the tasks status, identify those tasks which are on track and those that are behind, etc. Employees can use task dashboard to track their progress, gather all important information in one place, see which tasks require more efforts, and so on.
Learn how to create a dashboard
Task-Related Views
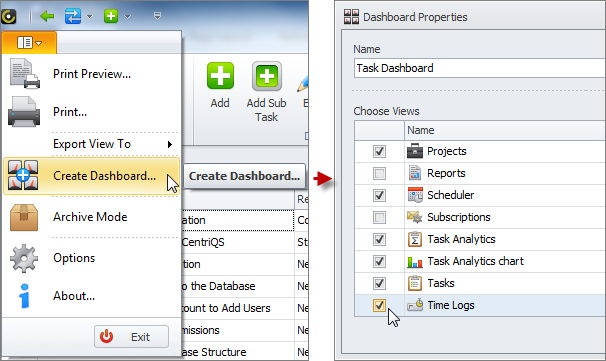
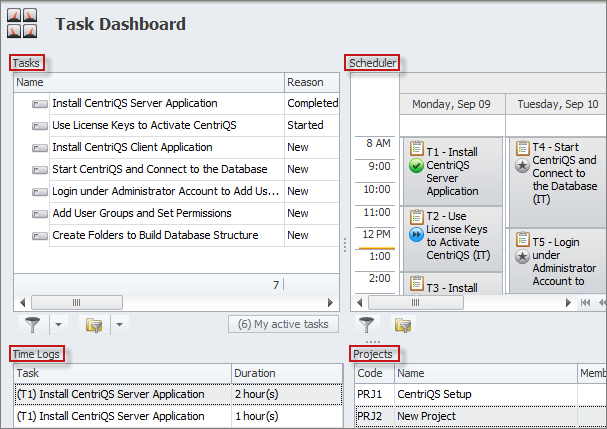
When you create a task dashboard in CentriQS dashboard software, you need to select what task-related views to display in it. Such views as ‘Tasks’, ‘Scheduler’, ‘Task Analytics’, and ‘Task Analytics Charts’ show tasks or their data in different formats (these views have direct relation to the entity ‘Task’). Such views as ‘Time Logs’ and ‘Projects’ don’t show tasks, but they show time logs that refer to tasks and projects to which tasks refer (these views have indirect relation to the entity ‘Task’).

Operational Task Dashboard vs. Analytical Task Dashboard
Dashboard view can display any view that you select for it, no matter whether it is operational view like Tasks or Scheduler or analytical view like Task Analytics or Task Analytics Chart. You can mix operational and analytical views in one KPI dashboard or have separate performance dashboards (because too many views within one dashboard are too small and that’s why become useless).
Operational Task Dashboard
Operational Dashboard can contain several operational views, but one of a kind (in comparison with analytical dashboard that can display multiple instances of one analytics view). For example, you can add view ‘Tasks’, ‘Scheduler’, ‘Time Logs’, and ‘Projects’ to your project status dashboard and work with these views without shifting form one view to another.

Analytical Task Dashboard
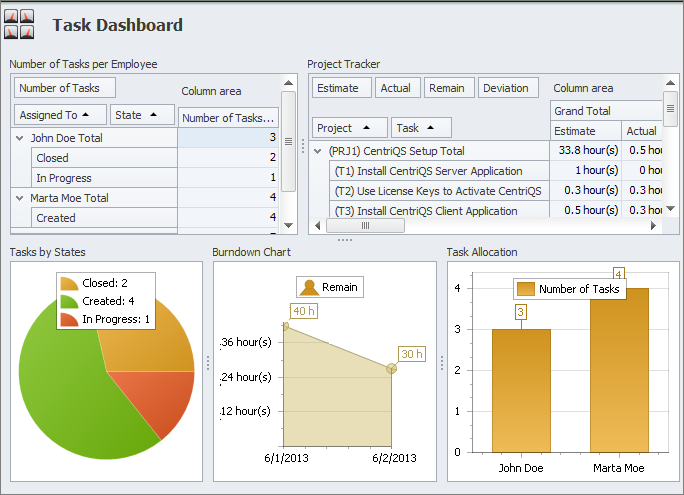
One Analytics Dashboard can contain several copies of Task Analytics and Task Analytics Chart views. You can select the number of analytic views when you select them in the Dashboard Properties window. For example, you can have 2 pivot grids and 3 charts which are set to show different analytics data in your project dashboard or employee dashboard.

Prev.: Task Analytics Charts || Next: Section: Task Planning
Next steps
{
Check out Task Management FEATURES
Watch Task Management Solution VIDEO OVERVIEW
Learn how to manage tasks in KNOWLEDGE BASE
DOWNLOAD CentriQS 30-day Free Trial Version
CONTACT US to get help with Task Management Solution